Teachers & students
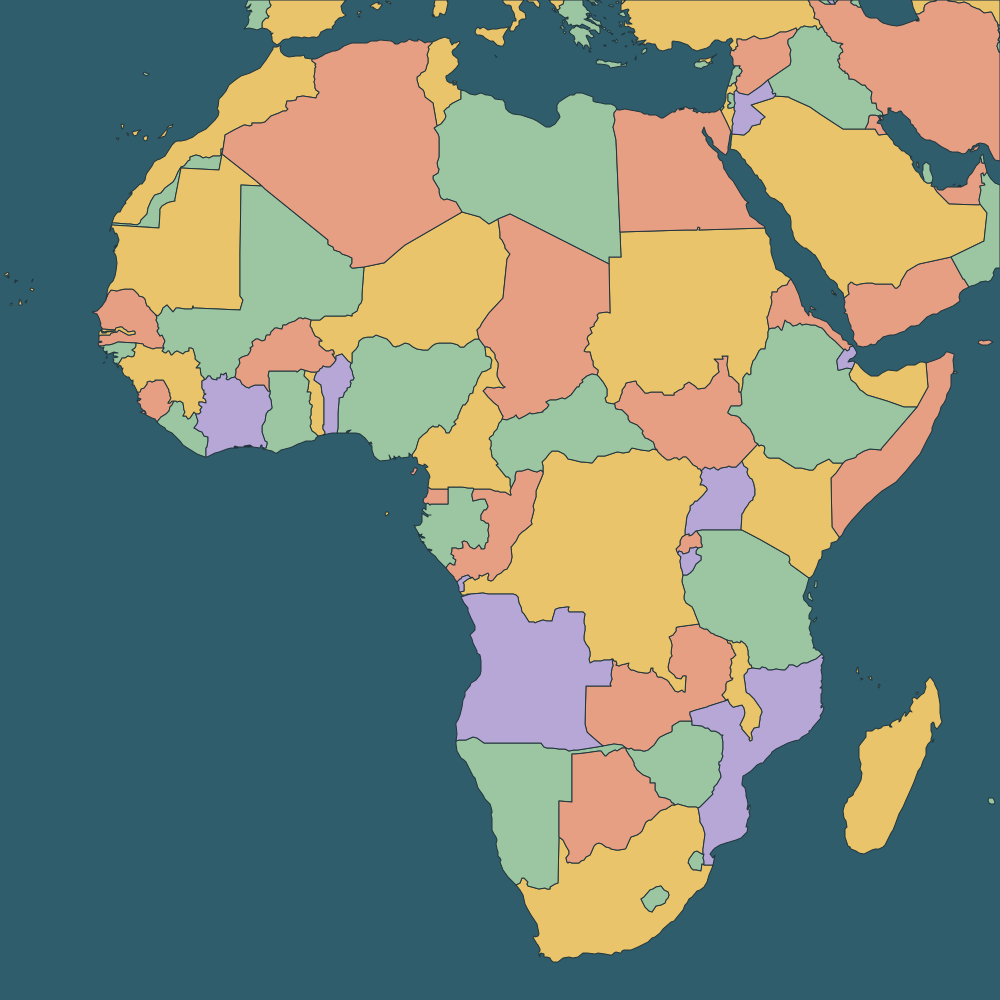
Print a blank map of Africa for a label-the-countries test, then make the answer key in two minutes with names switched on. The map quiz handles revision.
Tap a country to color it, name each color for the legend, then download PNG, SVG or PDF. No account, no watermark.
Print a blank map of Africa for a label-the-countries test, then make the answer key in two minutes with names switched on. The map quiz handles revision.
Tick off where you've been on the countries visited map or the 50 states map. It counts them for you and exports a picture to share.
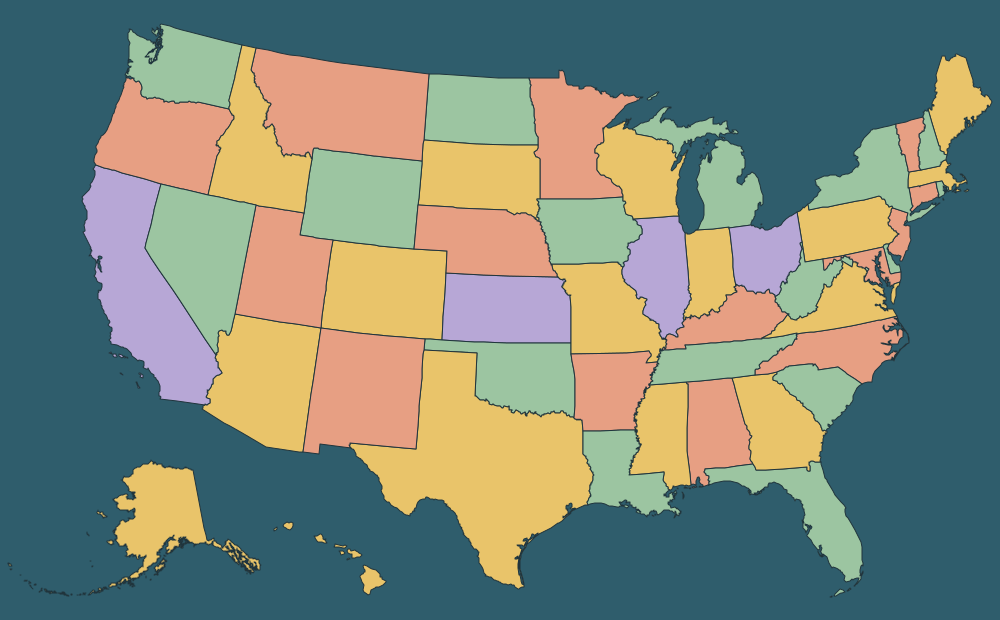
Paste sales, survey or census figures into the choropleth map maker and get a shaded map with a legend, sized for slides.
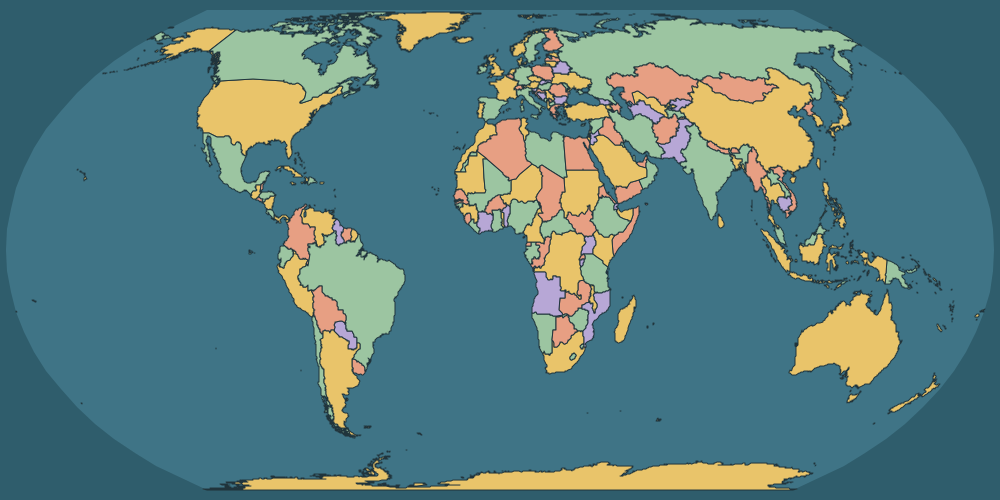
The world map uses the Equal Earth projection, so countries keep their true relative size: Africa is visibly about 14 times the size of Greenland, as it is in reality. Regional maps use equal-area azimuthal projections centered on each region, and the US map uses the Census Bureau's Albers layout.
Borders follow Natural Earth, which draws lines where control lies on the ground. Disputed areas such as Western Sahara, Kosovo, Kashmir and northern Cyprus are separate shapes, so you decide how to show them.
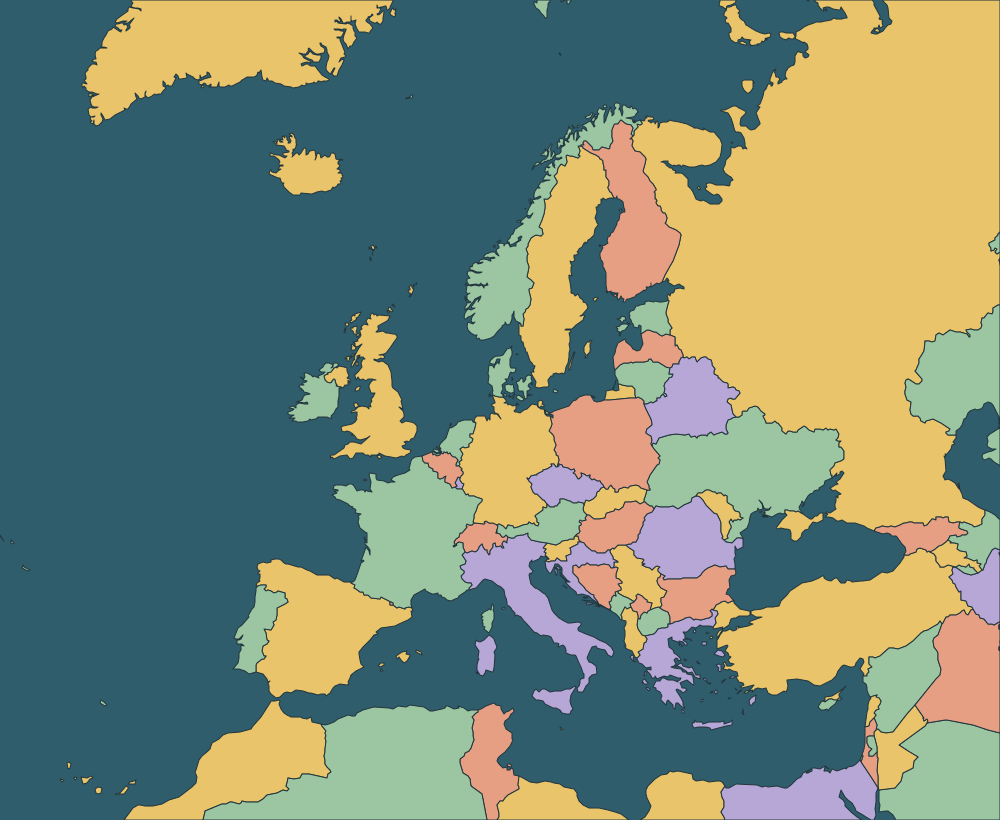
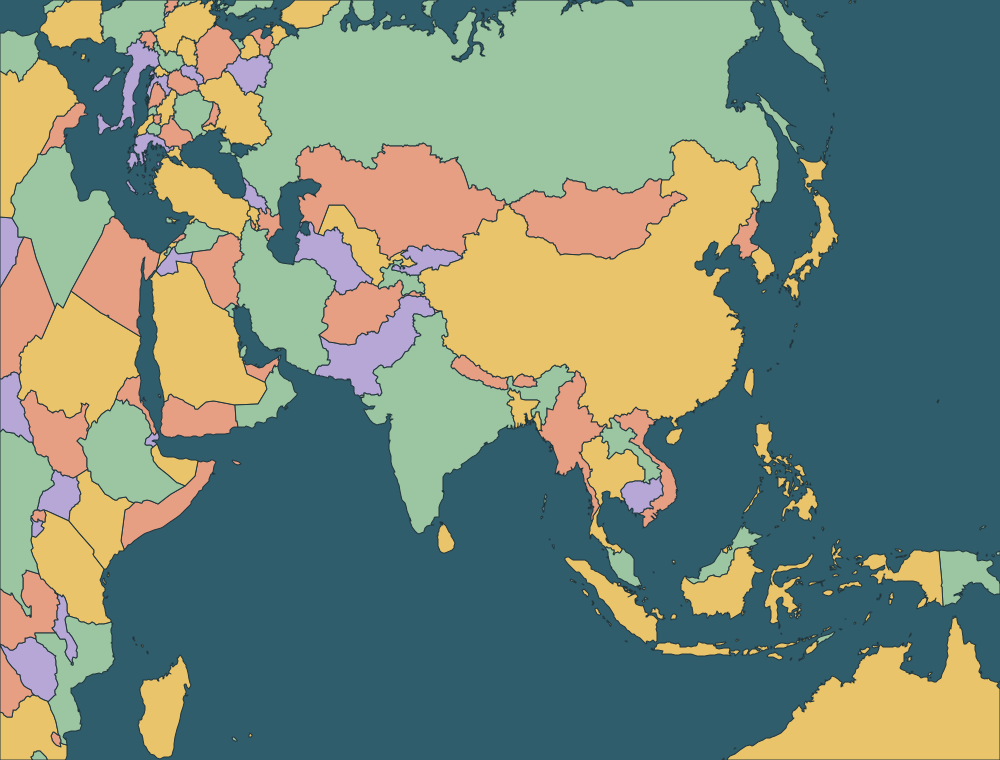
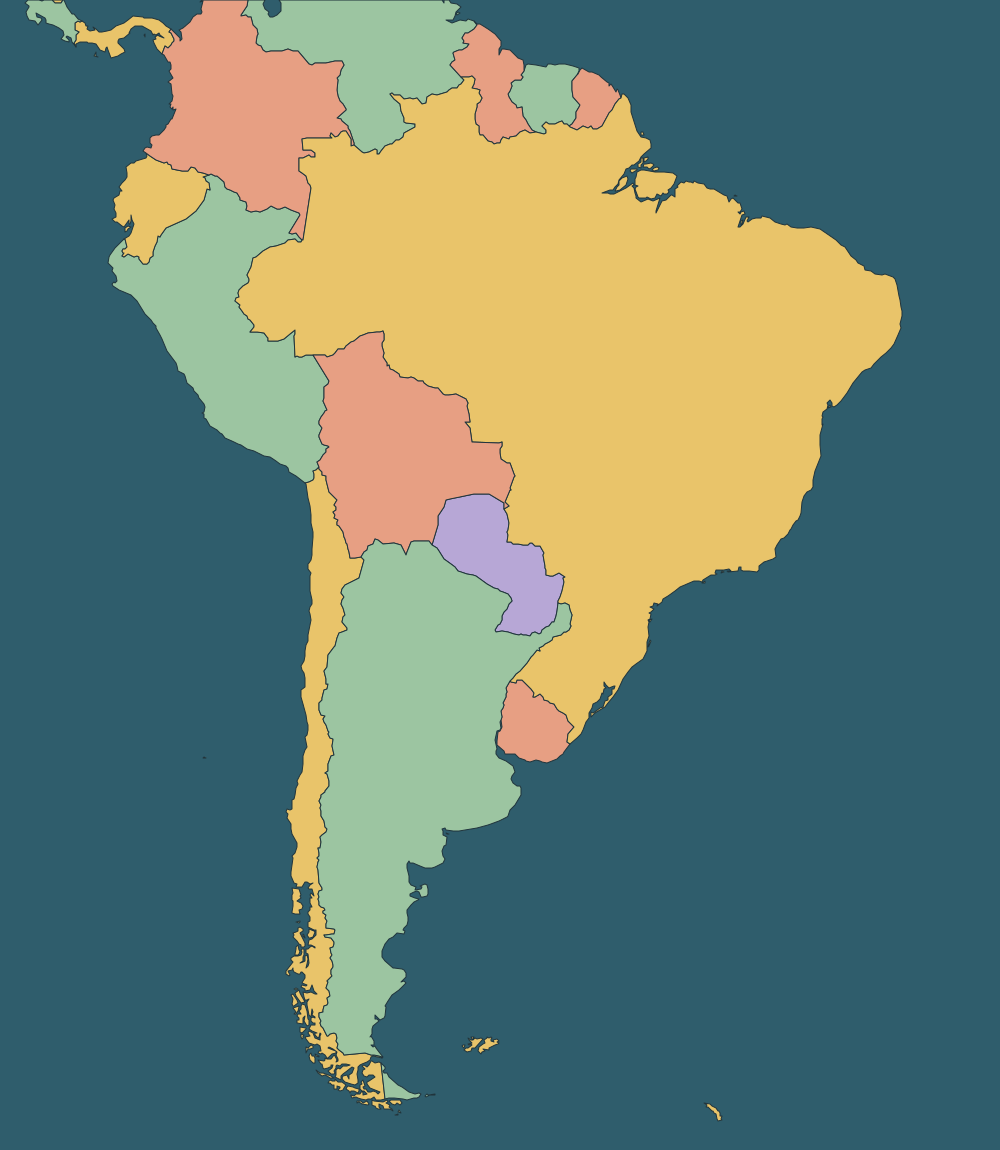
Each one opens in the editor, with printable PDFs (blank and labeled) and an SVG download. Labeled versions: world with country names, US with state names, Europe, Africa, Asia and South America. Also: the US map with capitals, and map quizzes for the 50 states, state capitals, Europe and Africa.
Yes. Coloring, labels, data maps and every export format are free, with no account and no watermark across the map. A small "mapeditor.io" credit is placed in the bottom corner of exports.
Pick a color under "Paint with" (or tap a swatch under the map), then tap countries. Tap a country again to clear it. Rename each color, for example "Visited" or "EU member", and the legend and counts update as you go. Press 1–9 to switch colors and E for the eraser on a keyboard.
No. The editor runs in your browser on a phone, tablet, Chromebook or desktop. Your map autosaves in this browser, and you can save a project file or copy a share link to keep it elsewhere.
PNG (standard and 4× print size), JPG, SVG with every region as a named, editable path, and PDF through your browser's print dialog. Every blank map page also has ready-made printable PDFs, blank and labeled.
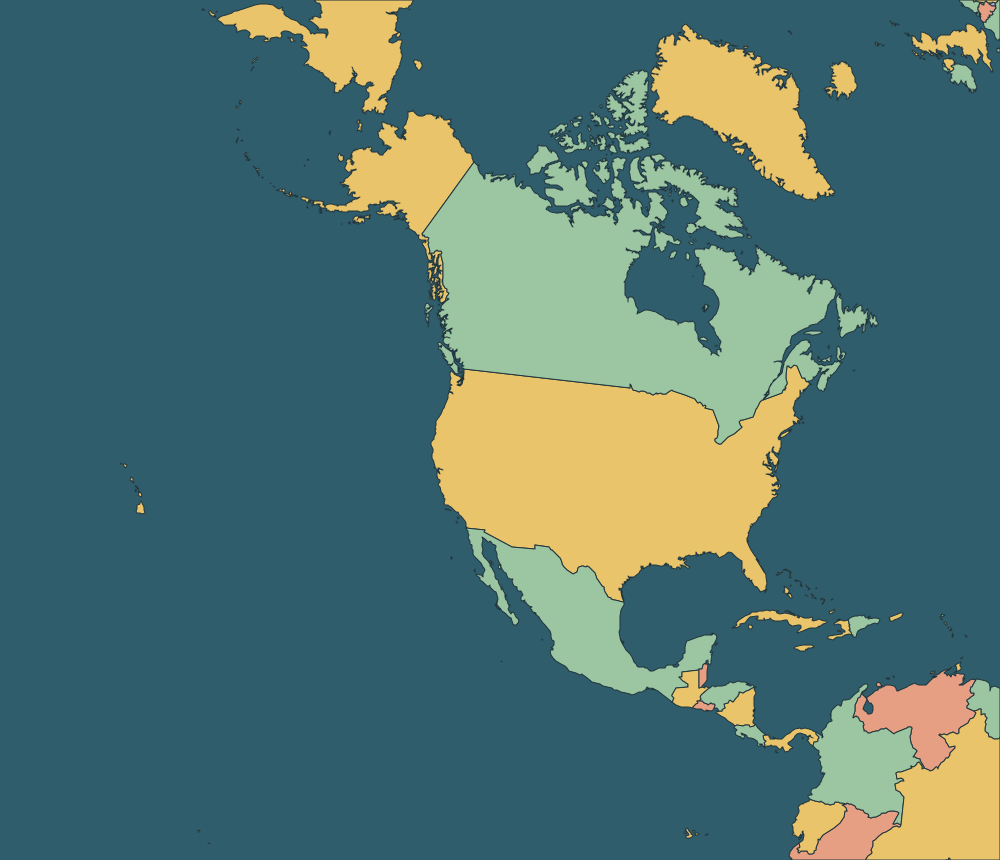
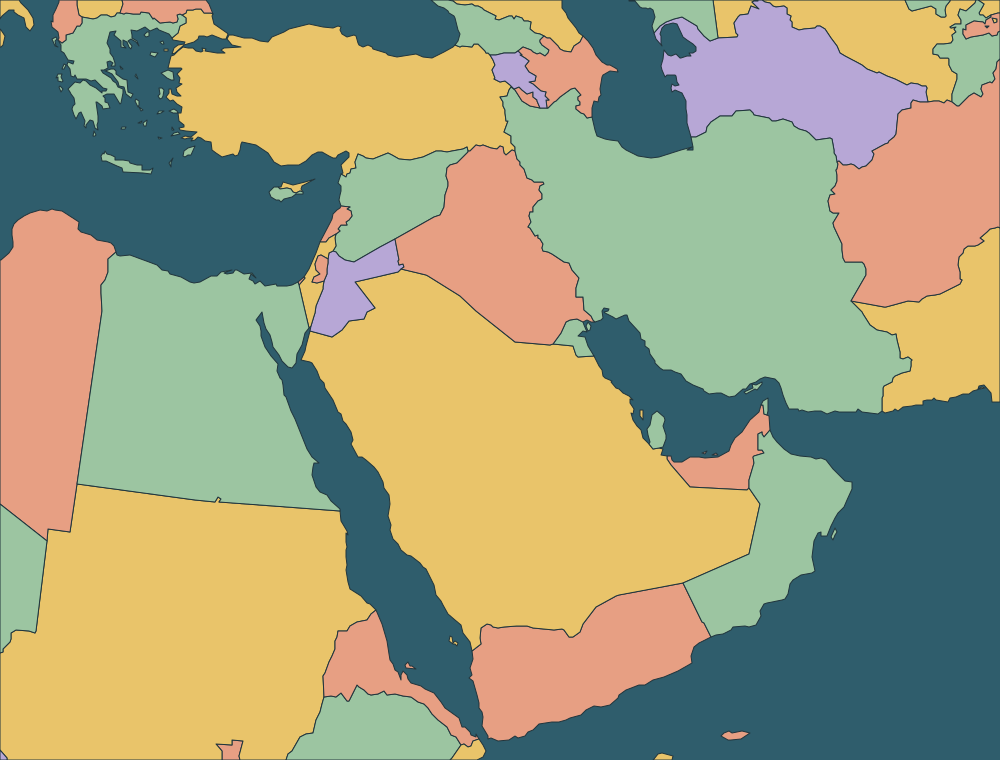
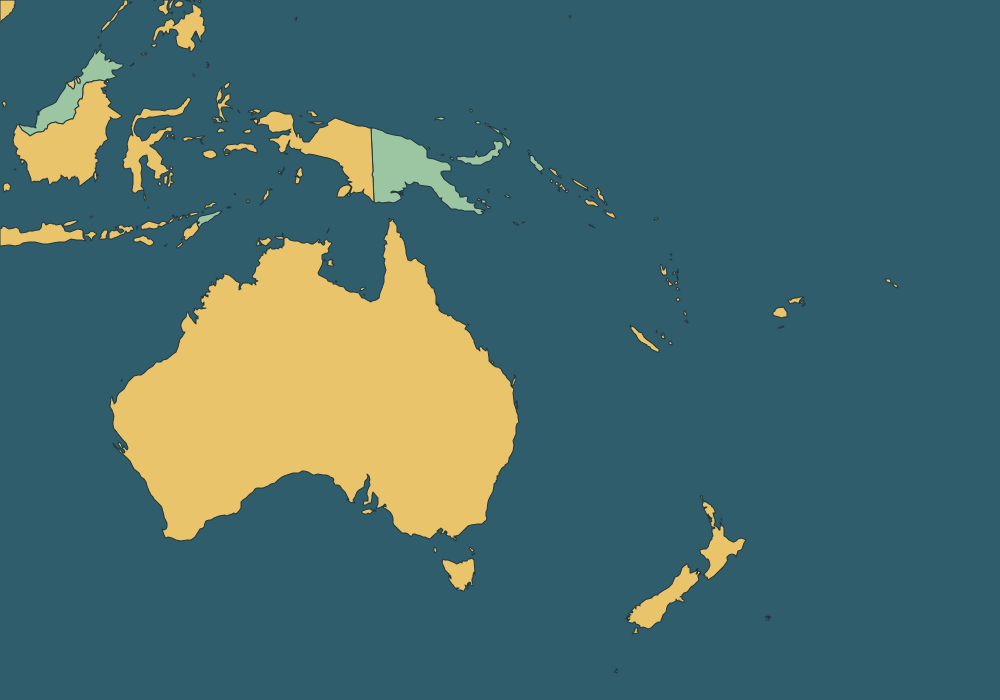
The world, the 50 US states, Europe, Africa, Asia, North America, South America, the Middle East and Oceania. Borders come from Natural Earth and the US Census Bureau.
Open the Data tab, paste two columns (name and value), and choose a color scheme. Numbers are split into classes; text values like "Member" or "Candidate" become categories. Country names, ISO codes and common spellings are matched automatically.
Describe a map in plain words, such as "countries that drive on the left", and an AI model picks the regions, colors and legend. It can be wrong or out of date, so check the result; you can fix any region by tapping it, or undo the whole thing.
Yes. The boundary data is public domain (Natural Earth, US Census), and what you make with the editor is yours to use in lessons, reports, books, videos or client work.